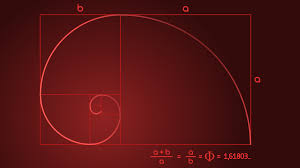
Humans are greedy—for knowledge, for power, and quite frankly, anything we can get our hands on. Our puny desire to explain the questions of the universe leaves us struggling to grasp just how unfathomable our world is. Fortunately, mathematics serves as a medium in an attempt to conceptualize such otherworldly phenomena, one being the golden ratio.
The golden ratio can be seen everywhere and at any given moment. It is a naturally occurring mathematical phenomena that can be seen in nature to optimize space and sunlight.
Sunflower seed arrangement exhibiting phyllotaxis, a natural pattern
associated with the golden ratio.
What’s really behind the golden ratio is a concept most students have been exposed to since elementary school: a sequence. More specifically, the golden ratio is based on the mathematical concept of the Fibonacci sequence.
While the name may beg to differ, the Fibonacci sequence was in reality founded by ancient Indian mathematicians centuries before explored by western mathematicians. It is named after the Italian mathematician Leonardo Pisano (also known as Fibonacci), who introduced the number sequence to Western Europe in 1202.
This series is a sequence of numbers where every number is the sum of the previous two numbers. For example, the very first term will begin with 0 and be followed by 1. 0 + 1 = 1, and 1 + 1 = 2. Thus, the sequence continues, 0, 1, 1, 2 … and so on. It can be written in general form as a recursive sequence such that
Fn = Fn-1 + Fn-2
where n = the nth term of the sequence
As the sequence gets larger, if you divide any Fibonacci number by the one immediately before it, the answer gets closer and closer to 1.618, which is the Golden Ratio!
If you want to find a specific Fibonacci number without adding up all the numbers before it, there’s a formula for that too—Binet’s Formula.
Fn = [ɸn – ( –ɸ)–n ] / √5
where ɸ = 1.618… (the Golden Ratio) or more accurately ɸ = (1 + √5) / 2.
This sequence can also be drawn into a spiral. First start with the squares of the numbers in the sequence (02 = 0, 12 = 1, 12 = 1, 22 = 4). These numbers will all make small rectangles side by side. Then, you can link opposite corners with a curved line, making a spiral.
This spiral (and its mathematical counterpart—the logarithmic golden spiral) is used mathematically to study fractal geometry, self-similarity, approximation limits, and polar coordinate systems. While artists value its beauty, mathematicians use it as a foundational tool to understand growth patterns where a shape scales up without changing its core proportions. In example, it can be used to calculate a hawk diving at its prey at a visually appealing angle while keeping it proportional to the lens.
Another application of the Fibonacci sequence is in the stock market. The Fibonacci sequence is used in technical analysis to identify potential support and resistance levels during price pullbacks. Traders use specific ratios derived from the sequence (most notably 23.6%, 38.2%, 50%, and 61.8%) to determine optimal entry points, stop-loss orders, and profit targets. The Fibonacci sequence (0, 1, 1, 2, 3, 5, 8, 13, 21, 34, etc.) has unique mathematical properties, where each number is the sum of the two preceding numbers. In stock trading, these numbers are converted into key percentages representing how much a stock’s price might “retrace” before continuing its overarching trend. Below is a breakdown of these key percentages:
38.2% & 61.8%: Considered the “golden ratios” of trading. These levels indicate areas where an asset is likely to bounce off its lows or find resistance during a rally.
50%: Though technically not a true Fibonacci number, it is universally accepted in technical analysis (inspired by Dow Theory) as a primary pivot point.
23.6%: Indicates a very short-term or shallow retracement, often watched in highly trending stocks.
Leave a Reply